Instruction
1
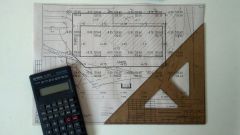
Before drawing up planograms need to collect statistics of popularity of a product and determine the number of visitors passing through a particular passage. This will allow you to calculate the coefficient of importance of trading places, which will be taken into account in the preparation of the planogram.
2
You can use for such calculations, even an ordinary Excel spreadsheets. To do this, take the goods of the same category, which, as a rule, should be placed next to, for example, "dairy beverages", "grocery", etc. Make a ranking of sales for each product category and by group. For example: milk, cheese, butter, sour cream or sugar, flour, pasta.
3
Determine for each item its share of the turnover, taking the entire category of over 100%. For example, the total quantity of milk is 40%, cottage cheese – 20%, butter 10%, sour cream – 20%, dairy products – 20%.
4
With this in mind, distribute the data products in accordance with the turnover share. If you have to breast gastronomy allocated 10 racks, for milk it is necessary to allocate 4 rack for cottage cheese products – 2, butter – 1 cream – 2 dairy – 2. For products of each group in the same way, calculate the concentration calculations for each brand that is sold in your store.
5
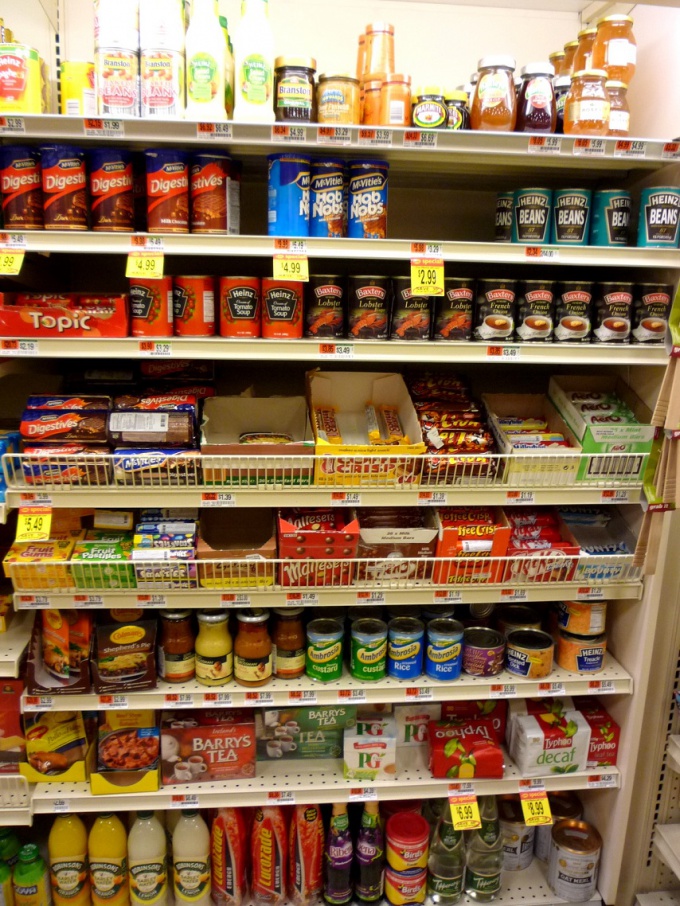
At its core, the planogram is a visual display of the operating standards of the merchandising system of pre-sale preparation of goods: the placement of shelves and products on them, window dressing and providing information about the products. Planogram enables the management of the commercial enterprise to manage the space where the sale of goods. With its help, you will be able to plan volumes of goods in accordance with sales.
Useful advice
To automate the process of drawing up planograms will help you one of the special software products, designed for this purpose. They will allow you to design the optimal placement of the shelving and display of goods taking into account the space of your sales area, design and intended range.