Instruction
1
Statistics are the result of the examination of a certain number of phenomena, objects, their signs are mass. For processing uses abstract mathematical models.
2
Mathematical statistics is divided into descriptive and analytical, which is also called the theory of statistical inference. Descriptive statistics includes methods of describing data, creating tables, etc. the same Analytical processes this data, formulates the insights. It also interrelated with the theory of probability.
3
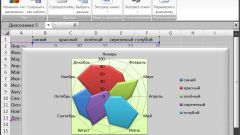
The polygon of frequencies is a graph of the probability density of a random variable. It represents the distribution of discrete and continuous features. Graph the polygon of frequencies is a broken line that connects the points corresponding to average values of intervals of the grouping (X axis) and frequencyof am of intervals (y-axis).
4
To build the polygon of frequencies, organize the primary data of experience (observation or process), group them by need basis, determine the intervals that contain a given range of values. Usually they are chosen equal, which facilitates data processing. The number and size of intervals is determined in each case separately and take into account the purpose of the experience (observations), the sample size of the data, the variation characteristic of the object.
5
Make a table on the basis of systematic data. Build on graph paper coordinate system. Label on the horizontal axis, the abscissa, the values of the variable characteristic, and on the vertical axis, the ordinate - frequencyof his changes. Take the data from the created table.
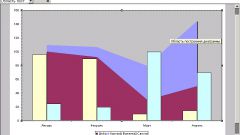
6
Find the points of intersection of these values. Connect consistently with each other. Polyline is a polygon of frequencies of your experience (observations) and reflects the changing character of the object in a given interval.
7
The data processing method of mathematical statistics is widely applied in sociology, biology, medicine, and also for analysis and research in many fields of science.