You will need
- - discrete variational series.
- - the range;
- pencil;
- eraser.
Instruction
1
Bring existing data into the form required for graphing. Divide the aggregate sample into two equal parts, to obtain a uniform position of the points on the graph. Most often, this is segmented into the time intervals: months, days, years. To use this method, calculate the characteristic value for each time period, for example, how many of units sold in each month. If the symptom varies slightly and discretely, use asinternal variational series (this can be, for example, student assessment).
2
Transmit the data to the table, you got two lines: first, specify the intervals or businterface values, and the second – the frequency of the common symptom. Add one more line – the accumulated frequency characteristic values. Complete this column, sequentially adding the frequencies from the second row. For example, if each month of the quarter consistently has sold 5, 3, 4 pieces of equipment, the accumulated frequency is equal to 5, 5+3, 5+3+4, that is, 5, 8, 12. Please note, each next value of the accumulated frequency will always be equal to or greater than the previous one, so the graph will never go down.
3
Build the coordinate system. On the horizontal axis place the characteristic values and on the y-axis is the cumulative frequency. Specify next to the axis name and unit of measure.
4
Dot in accordance with your table. To do this, use the values of the first and third rows, the row "frequency characteristic" to participate in building will not. Measure on the horizontal axis the value of the measured characteristic on the y-axis is the accumulated frequency, and at the intersection of the set point. When all the points are built, connect them with a polyline. This line is called cumulate number distribution.
5
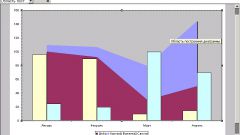
To build cumulate in Excel, enter data in rows or columns, then click "insert" - "chart". Select one of the matching scatter plots, select the desired to build the data (don't forget, only two lines – the characteristic value and the cumulative frequency) and click "finish". If necessary, correct the finished graph by using the window settings.


