You will need
- mathematical Handbook;
- - the range;
- - pencil;
- - notebook;
- - handle.
Instruction
1
Before you can begin to build the graph of the logarithmic function notice that the domain of definition of this function is the set of positive numbers: this value is denoted by R+. However, the logarithmic function is the domain of values, which is represented by real numbers.
2
Carefully read the conditions of the job. If a>1, the flow chart depicted an increasing logarithmic function. To prove this feature of the logarithm function easy. For example, take two arbitrary positive values of x1 and x2, and x2>x1. Prove that loga x2>x1 loga (this can be done by contradiction).
3
Assume that loga x2≤loga x1. Given that the exponential function of the form y=Ah if set and>1 increases, the inequality will be as follows: aloga x2≤x1 aloga. On the known definition of the logarithm aloga x2=x2, while aloga x1=x1. Because of this, the inequality becomes: x2≤x1, and this is directly contrary to initial assumptions, in accord with which x2>x1. So, you have come to the conclusion that we wanted to prove: if a>1 the logarithmic function is increasing.
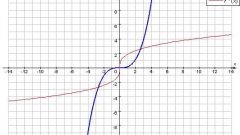
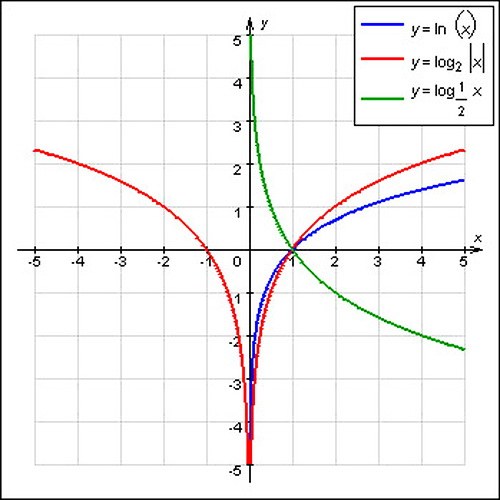
4
Draw the graph of the logarithmic function. The graph of the function y = logax will pass through the point (1;0). If a>1, the function will be increasing. Therefore, if 0
Note
If a job log will be denoted lg x, don't think that the authors of the mathematical benefits made a mistake by omitting the letter "o" in front of you is the decimal logarithm.
Useful advice
For accuracy of graphing logarithmic functions calculate, what will be equal to y at different values of x (0,5; 2; 4, 8). Based on these data put of the plot.