You will need
- Ruler, pencil, eraser
Instruction
1
To start indicate the domain of the function is the set of all admissible values of a variable.
2
Further, to facilitate plotting, set whether the function is even, odd or indifferent. The graph of an even function is symmetrical about the y-axis, odd functions relative to the origin. Therefore, for constructing such graphs will be enough to portray them in a positive half-plane, and the remaining part of the display symmetrically.
3
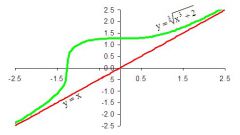
In the next step, find the asymptotes. They are of two kinds - oblique and vertical. Vertical asymptotes are looking at discontinuity points of the function and the ends the field definition. Inclined looking for, finding the corner and the free coefficients in the formula of a linear relationship.
4
Next, install the extrema of the function - the highs and the lows. You need to find the derivative of the function, then find its domain and equate to zero. In the resulting isolated points determine the existence of the extremum.
5
Determine the behavior of the graph of the function from the point of view of monotonicity on each of the resulting intervals. To do this, just look at the sign of the derivative. If the derivative is positive the function is increasing, if negative, decreases.
6
For a more precise examination of the function find the inflection points and intervals of convexity of the function. To do this, use the second derivative of the function. Find its domain, Paranaita to zero and determine the presence of inflection in the resulting isolated places. Bulge graphics define, exploring the sign of the second derivative at each of the resulting intervals. The function is convex upward if the second derivative is negative and convex if is positive.
7
Then find the point of intersection of the function with the coordinate axes and an extra point. They are needed for a more accurate plot.
8
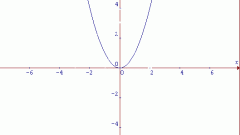
The construction of the graph. We must start with the image coordinate axes, indicate the scope and image of the asymptotes. Next, apply the extrema and inflection points. Mark the point of intersection with the axes and additional points. Then a smooth line, connect the marked points in accordance with the directions of convexity and monotonicity.
Useful advice
Asymptote's best to play by the dotted line.
