You will need
- Notebook, pen, pencil, ruler
Instruction
1
Find the domain of the function.
2
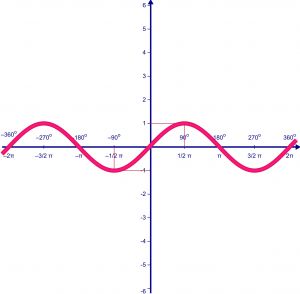
Explore feature parity, odd parity, periodicity.
3
Find the vertical asymptotes.
4
Find horizontal and slant asymptotes.
5
Find the point of intersection of the function with the coordinate axes (the zeros of the function").
6
Find the intervals of monotonicity of functions (increasing and decreasing). To do this, find the first derivative of the function. Where the derivative is positive the function increases and where the derivative is negative, the function decreases.
7
The points at which the function is continuous and the derivative is equal to zero, are points of extremum. If at transition through the point of extremum the derivative changes sign from plus to minus, it will be a point of local maximum of the function. If at transition through the point of extremum the derivative changes sign from minus to plus, it is a point of local minimum of the function. Calculate the value of the function at these points. Mark these points on the chart. Schematically depict where the function will increase and where to decrease.
8
Find intervals of convexity and concavity of functions. To do this, find the second derivative of the function, explore the sign of the second derivative. On intervals where the second derivative is greater than zero, the function is convex down. On intervals where the second derivative is less than zero, the function is convex upwards.
9
The point at which the second derivative is zero is an inflection point of the function. Find inflection points of a function. Calculate the value of the function at these points. Mark these points on the chart. Schematically depict the intervals of convexity and concavity of functions.
10
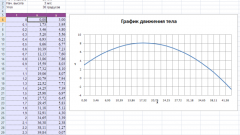
Find additional points of the function. Create a table: the value of argument value of the function.
11
Given the results of the research plot.
Useful advice
If the high precision of the graph, use the graph paper.