Instruction
1
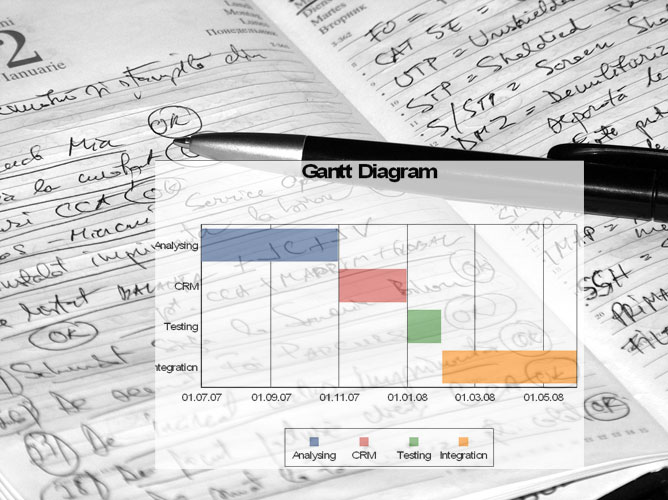
Start by constructing the so-called "field diagram". It is a two-dimensional grid, horizontal top (indented) are deposited periods of time in accordance with the projected duration of the actions vertically on the left – a list of scheduled events or tasks sequentially, the rows from top to bottom, one row per job. It should be remembered that the task list is a sequence of necessary actions which need to be made to ensure that the task was completed.
2
Leave free space to the right of the task list to specify the assignees for each task.
3
Ograniciti dotted lines across the chart height, top to bottom, start time, task execution time and total end. For example, a family going to the theatre. Fees start 17:00 end point (point of release) 18:00.
4
Then the points denote the beginning and completion of each task. For going to the theater, for example, the first – order a taxi (17:00-17:10).The second task is going and worn Mama (17:00-17:40), and the third is going to and dresses daddy (17:10-17:30), the fourth dress children (17:30 – 17:50). The last task before leaving: check the "everything is taken, nothing is forgotten" (17:50 – 17:57). Enter in the left free space in front of each task performers.
5
The gaps between the start point and end point for clarity, superimposed on length. Can different colors. In larger diagrams, the same colors are marked or similar action or actions in one phase, it is Important to understand this: the shaded intervals indicate on the diagram the execution time of a scheduled mandatory actions. For example, the father, after dressing in 17:30 could then sit to read the newspaper until 17:50 (target dress is made), and can help children get dressed and ready. However, if the goal was to "help children together" is required, it is included as a separate line in the chart , for example, is assigned to the Pope, from 17:30 to 17:50.


