Instruction
1
Draw a histogramusing a computer program. In the histogram the most important elements are the sign and the distribution. A sign is a phenomenon that you are studying in your study. Distribution - a set of answers points.
2
Build a two-dimensional coordinate plane. X will post the answers and the points on the y-axis is the frequency of their occurrence. Mark the results on the chart so that in the end, you get vertical columns, whose number coincides with the number of selected features. Their height must match the frequency of their occurrence. That information was perceived better paint columns in different colors. Color pick so that they don't "cut" the eye.
3
Open the application Microsoft Word. On the toolbar, select "Insert", click on it with the left mouse button and clicking on "Illustration". The illustrations look Charts. You will see a window with various kinds of graphs. Select histogram.
4
Click OK. Often to the toolbar rendered icon charting. Click on it and do the same thing. A window will appear with the data table. To draw a histogram, fill in these columns with all the necessary information. Click OK. The worksheet will appear in the histogram. To correct it, double-click it with the left mouse button. Thus you can rename the columns and axes.
5
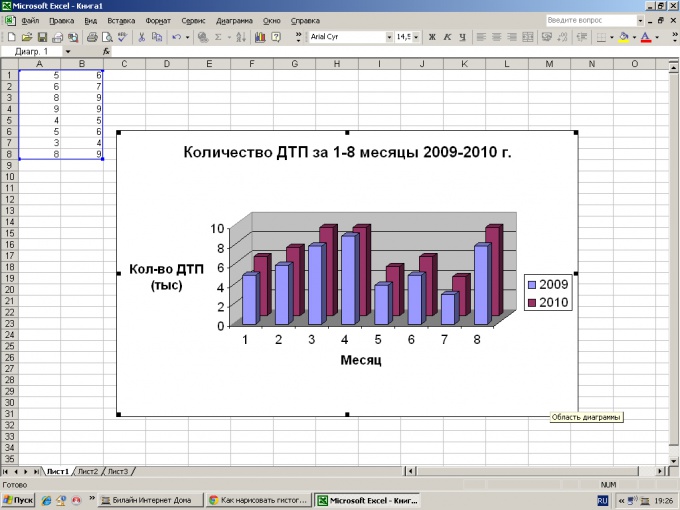
Open the Microsoft Excel application. The histogram build it much easier and more convenient than in Word, because it is easier to adjust the interval covered by the values. In an empty cell enter data corresponding to the coordinates. Then do the same things that you did in Microsoft Word. In the line "range", specify it manually or select filled cells.