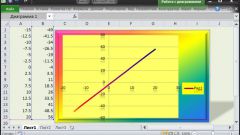
The diagram is one way of data representation. Consider two versions - 2003 and 2010, and versions 2007 charting is similar to the 2010 version, so consider this version of the program will not. So, how to make a chart version 2003?
1. Run the program. In a new workbook enter the data table.
2. Allocated to the prepared table.
3. Go to the menu “Insert”, select “Chart”.
4. In the window select the type of graph that you like, such as a conventional histogram.
5. Click “Next”.
6. You will see a window where you need to choose the source for the build. Initially, the selected source data table, so they will be recorded automatically in the field “Range”.
7. Again, click “Next”.
8. Now the chart setup. Here you can define the title and name the axes, configurable legend, set the caption to data. Nothing complicated, in just understand.
9. In the final window, choose the place where you insert the chart.
10. Ready!
How to make a chart from the 2010 version:
1. Run the program, fill the table with the relevant data.
2. Allocated to her.
3. Again the group Insert “Insert”, then bar Charts.
4. Select a chart type.
5. Once you have selected the chart type, the chart is automatically inserted into the worksheet where the data table.
6. All settings for the chart can be done if you click the graph, right-click and go to Format Chart Area.
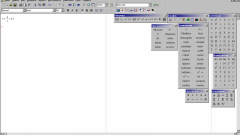
To graph it is also possible for a different program standard Microsoft Office package, text without leaving the word program. If you made a table there, go to “Insert” on the top bar and choose the icon with the graph. Clicking on it will call up a window where again, you must select the most suitable for your chart and click “OK”. After that, you will come up a window where you need to draw a table with data, and a picture of the chart will already be inserted in the vordovsky document. As soon as you enter the data in the table will change the figures inserted in the graph document. Labels to the chart, you can also sign in table and necessary settings are made, if you click on the picture right mouse button. In the drop-down menu will appear a lot of interesting settings, including changing the chart type, changing the labels, and the like. Thus diagrams in a text document. As you can see, there are no difficulties and the result is obvious, you can easily cope with this task independently.
How to build a chart
To build chart you must have at least some knowledge, start to act immediately by several methods. Tables Excel is a powerful tool with which you can process huge amounts of data to make a variety of computing, display them in tables, and the process of visualization becomes easy and convenient.

Is the advice useful?