Instruction
1
You must first run a Microsoft Office program if you have it. If not, then you can download the installer from the Internet or buy a CD at any specialty store. To download this program from the official site of Microsoft Corporation (http://www.microsoft.com/rus/).
2
After you run the program, go to the tab "Insert" button located on the toolbar in the left corner of the window.
3
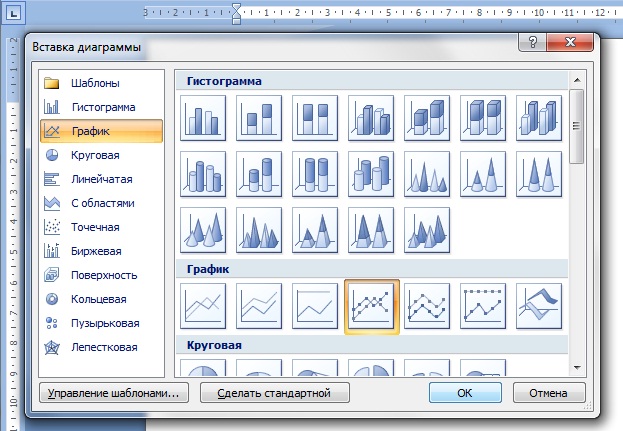
Then find the section "Illustrations". In it, you will be offered quite a large list of additional modules (e.g., figure, chart, picture, clip and so on) that you can use when working on a document. In our case, click on "Chart".
4
As a result, you should open a new window where you will be presented a wide list of chart types: line, pie, histogram, bar, scatter, surface, exchange, puzirkova, ring, spade. All these diagrams you can construct using Microsoft Word 2007. To graph, you need to select the appropriate button.
5
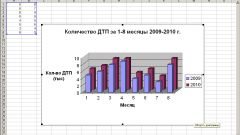
Next, a small window will appear in Microsoft Excel in which you want to specify specific values on which to build your schedule. Don't forget to enter all the names in the chart below subsequently make it easier to work with. Confirming the creation of the chart, you'll see it on the current page of the document. To edit this chart, you can at any time.
6
If after working with the schedule of his appearance you are not satisfied, then at any time you can change to a more suitable one. To do this, right-click the mouse on the graphic and select "Change chart type". In the new window, click on the most appropriate type of graph and click "OK". Your chart will automatically change in appearance.