Instruction
1
If the graph is a straight line passing through the origin and forming with the axis OX the angle α (the angle of inclination of a straight line to the positive half-axis OX). The function that describes this line will have the form y = kx. The coefficient of proportionality k is equal to tg α. If the line passes through 2 nd and 4-th quadrant, k < 0, and the function is decreasing if in the 1st and 3rd, then k > 0 and a function increases.Let the graph is a straight line, arranged in different ways relative to the axes of coordinates. It is a linear function, and it has the form y = kx + b, where variables x and y are in the first degree, and k and b can take both positive and negative values or zero. Video is parallel to the line y = kx cuts and on the y-axis |b| units. A line parallel to the x-axis, then k = 0 if the y-axis, the equation has the form x = const.
2
A curve consisting of two branches, located in different quarters and symmetric about the origin, is called a hyperbola. This graph expresses the inverse relationship of the variable y from x and is described by the equation y = k/x. Here k ≠ 0 is the coefficient of inverse proportionality. In this case, if k > 0, the function decreases; if k < 0 the function is increasing. Thus, the domain of the function is the entire number line except x = 0. The branches of the hyperbola approach the coordinate axes as their asymptotes. With decreasing k the branches of the hyperbola are more "pressed" into the coordinate angles.
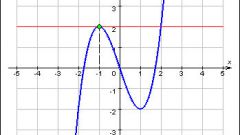
3
A quadratic function has the form y = ax2 + bx + C, where a, b and c values constant and a 0. If the condition b = C = 0, a function equation looks like y = ax2 (the simplest case of a quadratic function), and its graph is a parabola passing through the origin. The graph of the function y = ax2 + bx + C has the same form as the simplest case of functions, however, its peak (the point of intersection of the parabola with the axis OY) lies not in the origin.
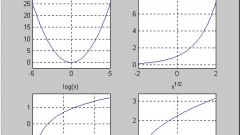
4
A parabola is also the graph of the exponential function expressed by the equation y = xⁿ, if n is any even number. If n is any odd number, the graph of this exponential function will have the form of a cubic parabola.
If n is any negative number, a function equation takes the form. The graph of the function with odd n is a hyperbola, and if n is even their branches are symmetric about the axis Oy.
If n is any negative number, a function equation takes the form. The graph of the function with odd n is a hyperbola, and if n is even their branches are symmetric about the axis Oy.