Instruction
1
What can we say about a function if its graph is a straight line? Let's see if this video passes through the origin of coordinates (that is, one where the values of X and Y is equal to 0). If held, such a function is described by the equation y = kx. It is easy to understand that the larger the value of k, the closer to the y-axis will be located this video. And the Y-axis actually corresponds to an infinitely large value of k.
2
Look at the direction of the function. If it goes "lower left – top right", that is, the 3rd and the 1st quadrant, it is increasing, if "top left to right down" (via the 2nd and 4th quarters), it is waning.
3
When video does not pass through the origin, it is described by the equation y = kx + b. Video crosses the y-axis at the point where y = b and y value can be positive or negative.
4
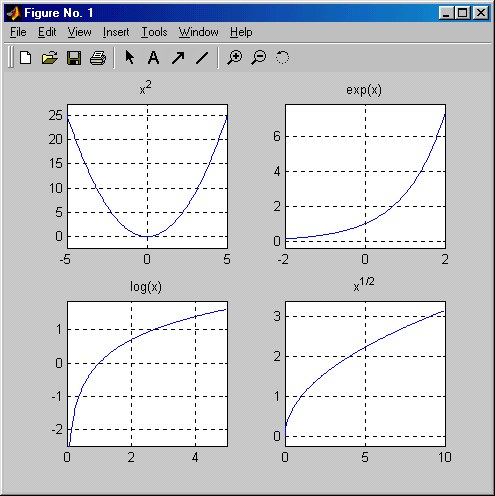
A function is called a parabola, if is described by the equation y = x^n, and its appearance depends on the value of n. If n is any even number (the simplest case of a quadratic function y = x^2) function graph is a curve passing through the origin and through the point with coordinates (1;1), (-1;1), since the unit in any degree will remain one. All values of y corresponding to any value X other than zero, can only be positive. The function is symmetric about the Y-axis and its graph is 1-St and 2-nd coordinate quarters. It is easy to understand that the larger the value of n, the close graph is to the y-axis.
5
If n is an odd number, the graph of this function is a cubic parabola. Curve is located in the 1st and 3rd coordinate quadrants, symmetrical with respect to the Y-axis and passes through the origin and through the point (-1;-1), (1;1). When a quadratic function is an equation y = ax^2 + bx + c form of the parabola coincides with the form in the simplest case (y = x^2), but its peak is not at the point of origin.
6
A function is called a hyperbola, if it is described by the equation y = k/x. It is easy to see that when the value of x tends to 0, the value of y increases to infinity. The function graph is a curve consisting of two branches which are located in different coordinate quarters.