Instruction
1
The first step in solving the task of identifying the intervals in which the function monotonically increases or decreases, will be the calculation of the scope of this function. For that, find all values of the arguments (the values on the x-axis), for which we can find the value of the function. Mark the points where there are gaps. Find the derivative of the function. Determine the expression that represents the derivative, Paranaita it to zero. After that it is necessary to find the roots of the resulting equation. Don't forget about the range of permissible values.
2
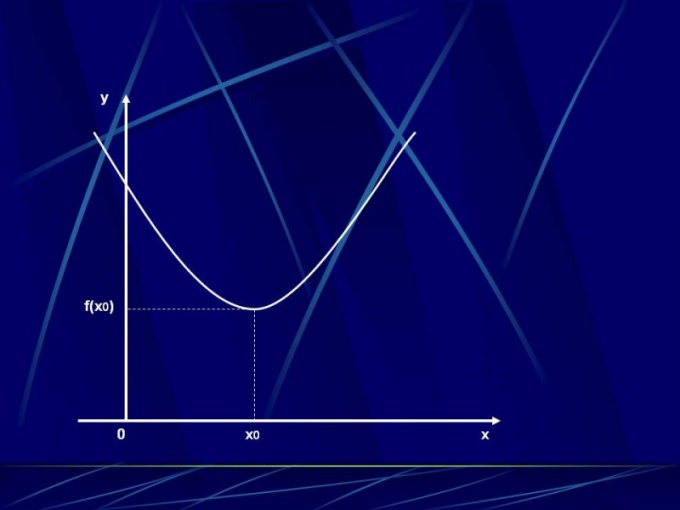
The points at which the function exists, or where its derivative is equal to zero, represents the boundaries of the intervals of monotonicity. These ranges, as well as the point between them should be sequentially in the table. Find the sign of the derivative functions in the resulting gaps. To do this, substitute in the expression corresponding to the derivative, any argument from the interval. If the result is positive, the function in the given range increases, otherwise decreases. Results are entered into the table.
3
In the row indicating the derivative of the function f'(x) is written corresponding to the argument values symbol: "+" — if the derivative is positive" -" negative or "0" is equal to zero. In the next line note the monotony of the original expression. The up arrow corresponds to increasing, arrow down – decreasing order. Mark the points of the extremum of the function. This is the point at which the derivative is equal to zero. The extremum can be either a maximum point or a minimum point. If the previous plot functions increased, and the current decreases, then it is the maximum point. In the case where from a given point the function is decreasing, now increases is a minimum point. Fill in the table values of the function at the points of extremum.