You will need
- computer;
- program Mathcad.
Instruction
1
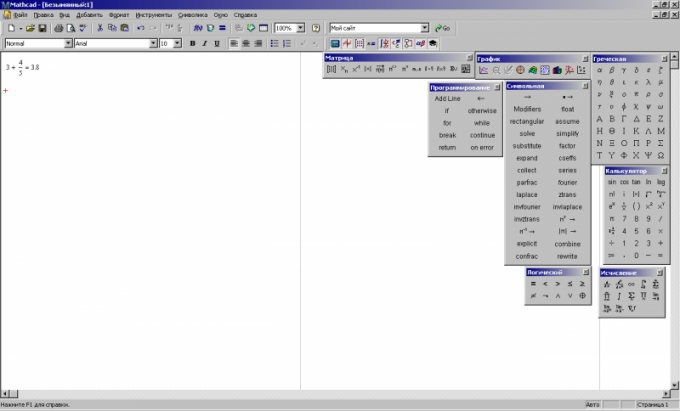
Run the program MathCad to perform the build. This application supports various types of functions. First, enter the expression that you want to make a graphical display. In mathematical symbols panel, click on the button which shows the graph. The screen will display a palette with examples of graphical elements.
2
Click in the palette on the button with a picture of a two-dimensional graph, the result will appear on the template. Enter in the input field the name of the independent variable placed on the X-axis, similarly, enter a name for the location along the y-axis, Click with the left mouse button outside the figure. Necessary construction in Mathcad completed.
3
Change the scale of the building. If you select it, the corners will appear figures that shows the scale of the axes Y and X. the default plotting in Mathcad is performed in the interval of change of x from -10 to 10 and the Y-axis scale is automatically set. After specifying the function to specify the range of the argument x. On the line with the formula, write x:= -30 to 30.
4
Change the appearance of the graph, click the right mouse button on the image, select "Format". In the tab "Axis" enable grid, set the number of cells. In the tab "Tracks" you can set the formatting of the lines, for example, to set the view: the dashed, solid, point. Go to the tab "Labels".
5
Enter in the appropriate boxes, label the axes and title the graph. After all the desired settings you can save them for later use. To do this, go to the tab "Defaults", set the check box "Use as default". To place on some axes of the two charts, the first record below the function second, click on the button with the letter "B", enter the formula and set range, the graph will be built on the same axes.


