You will need
- - variation of several numeric values;
- calculator.
Instruction
1
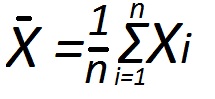
First, find the sample mean. To do this, add up all the values of the variational series and divide them by the number of study items. For example, if you want to find the coefficient of variation of three indicators 85, 88 and 90 to calculate the sample mean we need to add these values and divide by 3: x(CP)=(85+88+90)/3=87,67.
2
Then, calculate the margin of error the sample mean (standard deviation). For this purpose from each sample subtract the average value found in first step. Lift all the difference in a square and fold the received results among themselves. You got the numerator of the fraction. In the example the calculation would look like this: (85-87,67)^2+(88-87,67)^2+(90-87,67)^2=(-2,67)^2+0,33^2+2,33^2=7,13+0,11+5,43=12,67.
3
To get the denominator, multiply the number of sample points n (n-1). In the example this would look like 3x(3-1)=3x2=6.
4
Divide the numerator by the denominator and from the resulting numbers to Express a fraction to get the margin of error SX. You get 12,67/6=2 and 11. The root of 2.11 is equal to 1.45.
5
Proceed to the main point: find the coefficient of variation. To do this, divide the margin of error for the sample mean found in the first step. In the example of 2.11/87,67=0,024. To get the result in percent, multiply the resulting number by 100% (0,024х100%=2,4%). You have found the coefficient of variationand is equal to 2,4%.
6
Please note, the estimated coefficient of variation is quite small, so the variation of the sign is considered weak and the target population can be considered homogeneous. If the ratio exceeded the 0.33 (33%), the average value cannot be considered typical, and study through it the totality of would be wrong.
Useful advice
You can check the result by eye, to ensure his fidelity. Rate about the sample elements, if they are almost identical, you should get a small percentage. The greater the scatter of the index, the greater the coefficient of variation.