You will need
- Calculator.
Instruction
1
There are different types of deviations. Each of them differs in the nature of the phenomenon that is being studied, and the method of calculation.
2
Initially, the results of any calculations are expressed as absolute values which reflect the level of development of the phenomenon under study. Absolute deviation is the difference obtained by subtracting one value from another. Expressed in physical units. If its value is positive, it means the figure in dynamics, and Vice versa.
3
The relative deviation represents the deviationcalculated in relation to other values. Expressed in percentages or ratios. This files most often calculated in relation to any common indicator or parameter.
4
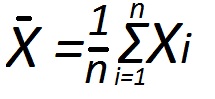
If we are talking about comparing values together, then expect the so-called performance variations. The simplest to calculate is the range of variation. It reflects the difference between the highest and lowest values. The main synthesis parameters are the variance and average quadratic deviation. The first represents the average of the squared deviations of each characteristic value of the total average. Depending on original data can be calculated using simple arithmetic mean or weighted. The second indicator is calculated as the square root of the variance.
5
The method of calculating selective deviations involves comparing controlled variables related to a particular period of time: quarter, month or day. Their calculation is particularly relevant for companies whose activity is seasonal.
6
The analysis of the budget using the cumulative deviations. It represents the difference between the amounts calculated cumulatively. Comparison of these values allows us to estimate the level achieved in the previous periods and possible difference to the end of the plan.
7
In the analysis of activities the main point is to compare actual performance against the planned values or planned regulatory measures. Based on it is a prediction of the results at the end of the plan period.