Instruction
1
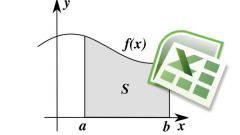
By definition of the integral, it is equal to the area of the curvilinear trapezoid bounded by the graph of the given function. When you want to find the area of the figure bounded by lines, it is about curves given on the graph the two functions f1(x) and f2(x).
2
Suppose that on some interval [a, b] given two functions defined and continuous. And one of the functions of the chart is higher than the other. Thus, there is a visual figure, bounded by lines of functions and lines x = a, x = b.
3
Then the area of the shape can be expressed by the formula integrating the difference function on the interval [a, b]. Evaluation of the integral is made by the law of Newton-Leibniz, according to which the result is equal to the difference between the integral of the function from the boundary values of the interval.
4
Example1.
Find the area of the figure bounded by straight lines y = -1/3·x – ½, x = 1, x = 4 and the parabola y = -x2 + 6·x – 5.
Find the area of the figure bounded by straight lines y = -1/3·x – ½, x = 1, x = 4 and the parabola y = -x2 + 6·x – 5.
5
Solution.
Plot all lines. You can see that the line of the parabola is above the line y = -1/3·x – ½. Therefore, under the integral sign in this case there must be a difference between the equation of a parabola and the given straight line. The interval of integration, respectively, is located between the points x = 1 and x = 4:
S = ∫(-x2 + 6·x – 5 – (-1/3·x – 1/2))dx = (-x2 +19/3·x – 9/2)dx on the interval [1, 4].
6
Find the integral for the resulting expanded expression:
F(-x2 + 19/3x – 9/2) = -1/3x3 + 19/6x2 – 9/2x.
F(-x2 + 19/3x – 9/2) = -1/3x3 + 19/6x2 – 9/2x.
7
Substitute the values of the cut ends:
S = (-1/3·43 + 19/6·42 – 9/2·4) – (-1/3·13 + 19/6·12 – 9/2·1) = 13.
S = (-1/3·43 + 19/6·42 – 9/2·4) – (-1/3·13 + 19/6·12 – 9/2·1) = 13.
8
Example 2.
Calculate the area of the figure bounded by the lines y = √(x + 2), y = x and the line x = 7.
Calculate the area of the figure bounded by the lines y = √(x + 2), y = x and the line x = 7.
9
Solution.
This task is more complex than the previous one, because there is a second straight line, parallel to the x-axis. This means that the second boundary value of the integral is indeterminate. Therefore, it must be found from the graph. Build the specified line.
This task is more complex than the previous one, because there is a second straight line, parallel to the x-axis. This means that the second boundary value of the integral is indeterminate. Therefore, it must be found from the graph. Build the specified line.
10
You will see that the straight line y = x goes diagonally along the coordinate axes. And the graph of the function root is the positive half of a parabola. It is obvious that the lines on the graph intersect, so the intersection point will be the lower limit of integration.
11
Find the point of intersection, solving the equation:
x = √(x + 2) → x2 = x + 2 [x ≥ -2] → x2 – x – 2 = 0.
x = √(x + 2) → x2 = x + 2 [x ≥ -2] → x2 – x – 2 = 0.
12
Determine the roots of the quadratic equation using the discriminant:
D = 9 → x1 = 2; x2 = -1.
D = 9 → x1 = 2; x2 = -1.
13
It is obvious that -1 is not a solution because the abscissa of the crossing currents – positive magnitude. Consequently, the second limit of integration x = 2. The function y = x on the graph above of the function y = √(x + 2) so the integral it will be the first.
Integrate the resulting expression on the interval [2, 7] and find the area of the shape:
S = ∫(x - √(x + 2))dx = (x2/2 – 2/3·(x + 2)^(3/2)).
Integrate the resulting expression on the interval [2, 7] and find the area of the shape:
S = ∫(x - √(x + 2))dx = (x2/2 – 2/3·(x + 2)^(3/2)).
14
Substitute the range values:
S = (72/2 – 2/3·9^(3/2)) – (22/2 – 2/3·4^(3/2)) = 59/6.
S = (72/2 – 2/3·9^(3/2)) – (22/2 – 2/3·4^(3/2)) = 59/6.