Instruction
1
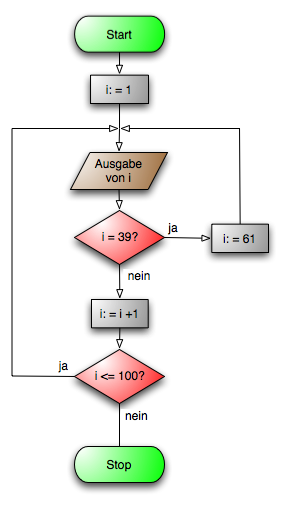
First, any block-schema check element entering the program. It is indicated with a rectangle with rounded edges, inside it write the command "Start". This will be the starting point of your flowchart. After the initial draw shapes straight line to continue down the flowchart.
2
Generally, the first algorithm is the input data for the task. Draw a parallelogram below the line so that it was an uninterrupted continuation of the scheme. In the parallelogram produced by the write action, this is usually operation of reading data from the screen (Read nInp) or other devices. It is important that you enter the names of the variables in this step will be used throughout the body of a block diagram.
3
Executing one or group of operations, any data processing (the change in the value or form of representation is in the form of a rectangle. Draw this figure in the algorithm in the preparation of a block diagram. Inside the rectangle, write down actions with variables, for example, the assignment operation can be written as follows: mOut = 10*nInp b + 5. Further, as to continue a block diagram draw a line down.
4
An important part of any algorithm and therefore the flowcharts are conditional and cyclic operators. Data operators have one input and two or more alternative exit. After calculating the conditions specified by the operator, a further transition is performed only in one path. Draw the input element in the form of a line included in the top vertex of the element.
5
To set the condition statement to draw from this line rhombus. Inside the shape, specify the condition itself and draw lines indicating a further transition depending on its implementation. The condition is set in the General case, by comparison operations (>, <, =). The transition line down is when the true condition, ago – when about. Indicate approximately the output lines of the figure the results of the conditions (true, false). Failure to comply with condition (false) returns to a specific step above the body of the algorithm. Draw lines at a right angle from the exit terms and to the right of the operator.
6
The cyclic operator is denoted by the rectangles with beveled corners. And to draw this operator uses two edge pieces. The beginning of a cycle is given by figure with beveled upper corners, the end of the cycle – shape with a beveled bottom corners. In the figure the beginning of the cycle specify the operation condition of the cycle and between the perimeter figures to draw the inner loop operator.
7
At the end of the flowchart must contain the output data to the media or on screen. The operator o is drawn similarly to the input statement. Draw a parallelogram and inside it an output operation using the output variables.
8
At the end of a block-diagram draw element-terminator – a rectangle with rounded edges. Inside it write the word "End". The block diagram is complete.