You will need
- Table editor Excel
Instruction
1
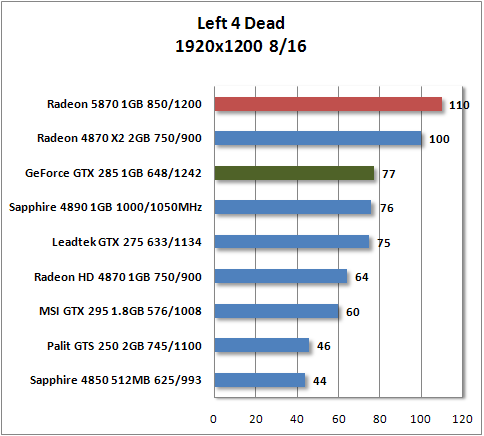
Of course, the easiest way, the label is creating a text column next to the column of numeric data. That is, the graph will be created from numeric data, the signatures will automatically be imported from a text column. At its creation it is necessary to consider that the signature of a data cell needs to coexist with the appropriate data cell.
2
The signature of the graph should be filled in when creating it. Open "Wizard chart" (located in the toolbar) and in the "chart Title" and type signature.
3
In the case where you need to insert a chart in a presentation or in a printed publication, you may want to create fancy signatures. The easiest way of obtaining it is to work with the diagram in picture mode. Take a screenshot of the screen using the Print Screen button and paste the image from the clipboard into any graphics editor. Now you will be able to create any signature (drawn or assembled from clip-art (small pictures templates).
Useful advice
A good signature should not strongly evident. Do not use bright colors(red, blue, green). The classic black and shades of gray.
