Instruction
1
When you build the level lines start from the fact that they are projections onto a plane with zero applicate of the intersection of the graph of the given function with a certain horizontal plane. Applicate the section plane is constant, which we need to equate the equation of the function to obtain the coordinates of the points of the line. It can change with a given in terms of the problem step if the build requires a set of lines. But if you need to build only one line of levels, conditions can be given the coordinates of a point lying on it. Graphs with this page, you can save or edit it online.
2
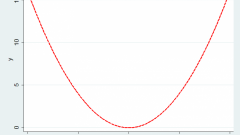
Power is defined in terms of the problem the function to the form f(x,y) = const. For example, given the formula z = x2 + y2 - 4*y, it can be written in an alternative form to better represent the shape of the function, and equate to a constant c: c+4 = x2+(y-2)2. Volume graph of such a function is an infinite paraboloid, and all of its section by a horizontal plane raised to different levels (i.e., desired levels) are concentric circles with a radius determined by the formula √(c+4).
3
Replace the constant c given in terms of the value for the level line. If it's not given - select themselves, based on ranges of values of the function. For example, for the above example, the minimum value of the constant may be the number -4. The constant can be equated to 5 in this case, the graph of a function is a circle with a radius of √(5+4) = 3 and centered at the point with abscissa 0 and ordinate equal to 2.
4
If you want to build a few level lines, repeat the previous step as often as necessary.
5
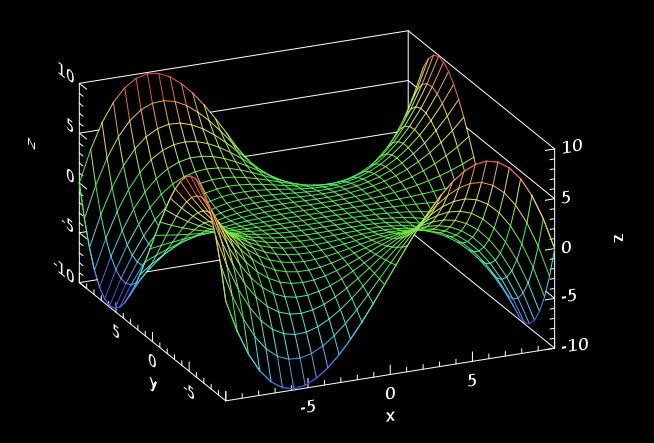
In the Internet you can find services that will help with the construction of level lines. For example, below is a link to the service WolframAlpha. In the input box on the page type the formula of a function and click the button with the icon of equality. Used example the function z = x2 + y2 - 4*y must be entered in this form: x^2+y^2-4*y. After a few seconds the page will appear two - dimensional and three-dimensional color graphs with lines, levels, and classification of the shapes described by the formula, alternative forms of recording and other properties of functions that can be used to produce level lines.