Instruction
1
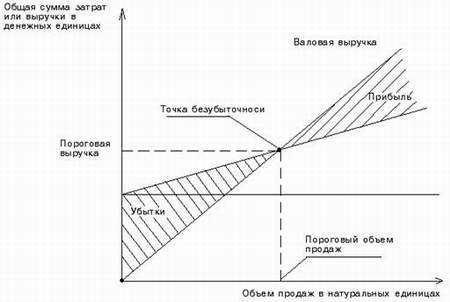
In the first break-even chart is presented in 1930 by Walter Rautenstrauch. This type of planning is called the critical graph of volume of production (break-even chart). In economic theory the costs (expenses) of production are fixed and variable. To build a break-even chart are only fixed costs. For a start, displays two axes. X-axis shows the cost, Y axis is superimposed quantity of the production. In classical economic theory by increasing the amount of production in the enterprise, grow in proportion to the total costs.
2
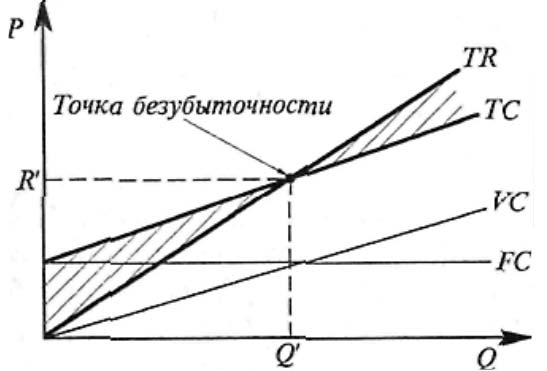
When plotted, the price of the materials and products largely unchanged for a certain period. Sales occur evenly according to plan. When you change the volume of production and sales variable costs do not change. In order to build a break-even chart you need on the schedule to put three lines. Fixed costs (WIP) applied parallel to the axis of the output. Line total costs (VI) increasing variable costs. Total costs (VI) is the sum of fixed and variable costs. The following line revenues (BP).
3
At the intersection of revenues and gross (total) costs, a point of break even (To). The breakeven point shows the company zero profit with no cost. Right to build a break-even chart will enable the company to relate all the costs and income from sales. With the help of break even chart it is possible to calculate an accurate forecast of enterprises and its main indicators.
Note
Using graphics it is possible to quickly obtain a fairly accurate forecast of the main indicators of the company in the changing market conditions.
Useful advice
Exists and is an analytical method that allows you to select the best option when comparing several technologies.