Instruction
1
In order to construct a curve of demand and proposals necessary to define the concept of demand. Demand is the willingness and ability of buyers to purchase a particular product or service. The curve of demand rising at a lower price and decreases with a higher, hence the lower the price the higher the demand. For the image curve of demand on the paper is constructed of the coordinate axis. The vertical line indicates the price (price), the horizontal is quantity.
2
The proposal is the ability and willingness of sellers to offer a product or service. Curve offers increases with the increase in commodity prices, as a consequence, the curve decreases with decreasing prices. For the image curve of a proposal on a new sheet of paper is constructed a coordinate axis. Marking the coordinate axes is the same as when you build a curve of demand.
3
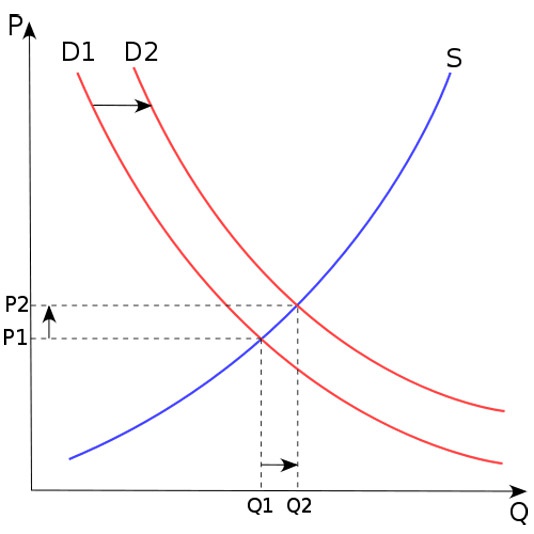
Superimposing on each other the curves of demand and suggestions, it is possible to consider in detail the pricing process in the market. Equilibrium occurs when the same amount of demand for a product and its offer on the market. The S (supply) is a curve of the proposals, the curves D1 and D2 (demand) - curves of demand.
4
If the price is initially set above the level of P2, in this situation, the supply exceeds the demand, and the latter is in turn reduced. If the price is initially below the level P2, then the demand exceeds the number Q of goods and services available on the market.
Note
Beyond the equilibrium prices are formed two zones – the zone of excess goods and area of shortage of goods. Shortages may develop into a crisis of underproduction.
Useful advice
At exactly the equilibrium price in the market are always exactly as many goods as necessary for the consumers, there is no excess or deficiency of wealth.