By EasyHow
How to make a graph
In Microsoft Office Word documents and Excel spreadsheets, you can create graphs that will visually display the entered data. Charts are an excellent tool for creating reports and presentations, and their formation does not require deep knowledge of computer.
Instruction
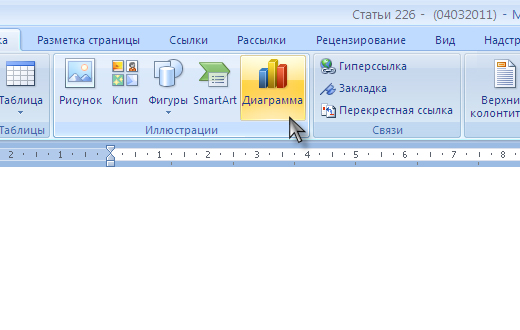
To make a graph in Word 2007 document, go to the insert tab and select Chart.
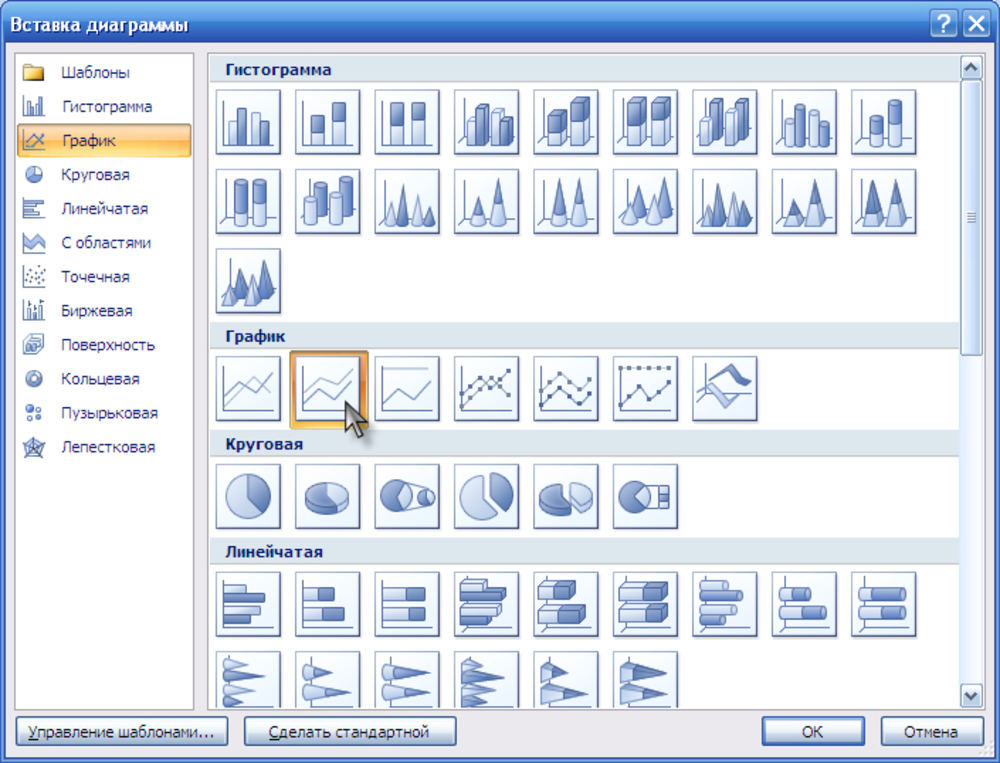
In the opened window click "Chart", choose one of the design options and click "OK".
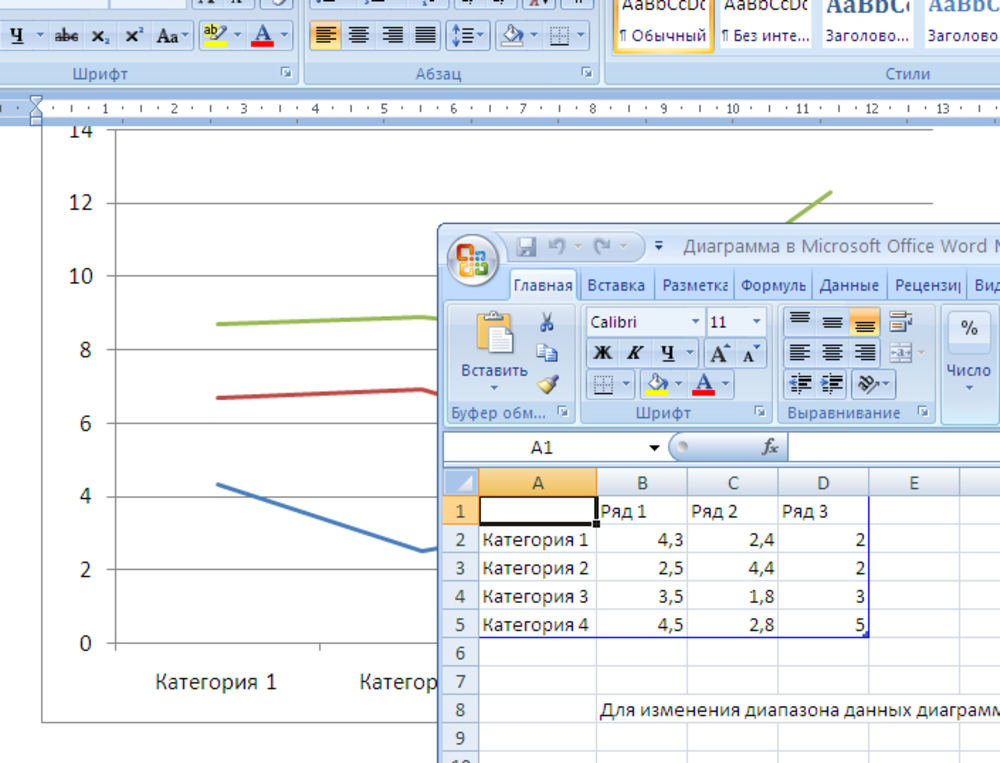
On the page of your document will appear in the chart and a window will open Excel spreadsheets for editing the displayed data.
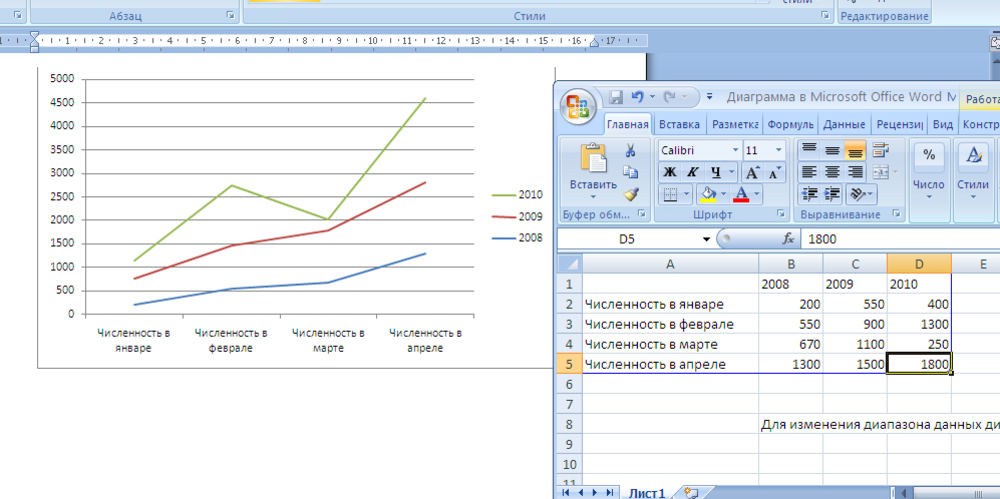
In the table window to Excel enter required statistical data, and you will see how the figures in the chart will change.
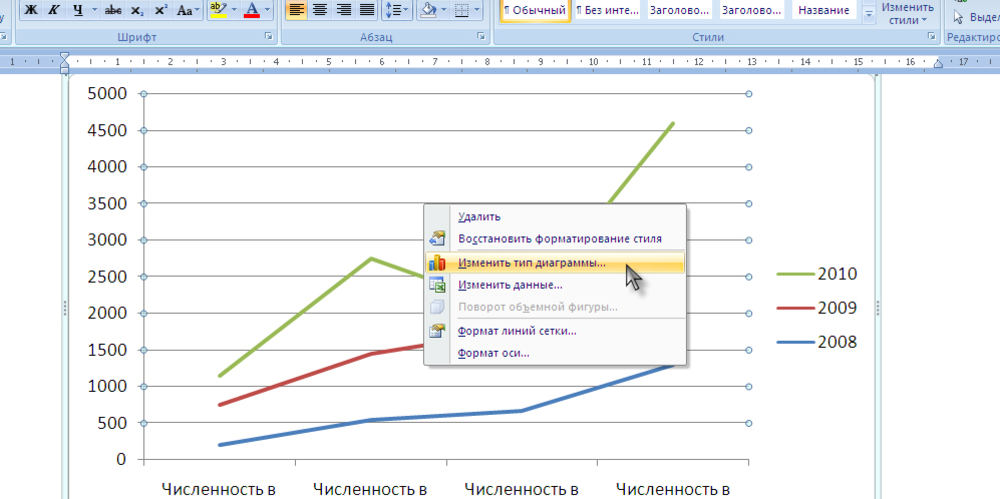
If after entering this data, the chart view does not suit you, you can always change to a more suitable one. To do this, right-click on the picture and select "Change chart type".
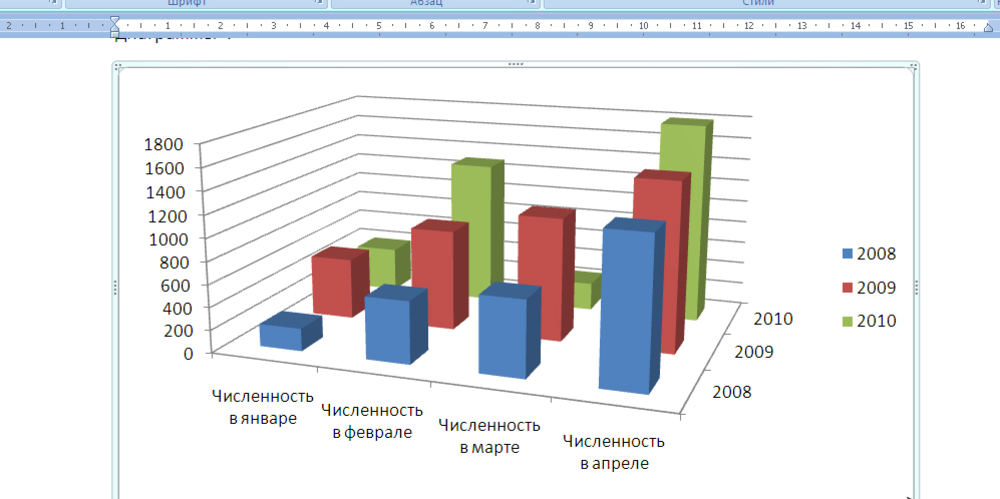
In the window that appears, select a different chart type and click OK. The graph will automatically change.
Useful advice
The resulting chart can be copied and pasted into Excel spreadsheet or Power Point presentation.