You will need
- computer;
- - installed Microsoft Office.
Instruction
1
Microsoft Office is a versatile program that allows you to perform documents the various operations, from simple set and edit text to create the various diagrams, tables and charts. To add a chart to a document in an existing project or a newly created.
2
Open a text document. Or right click the mouse on the free field of the desktop or the empty space of the folder where you intend to place the file, and select "Create". Then in the drop down box select the type of document - Microsoft Word. Rename the file and open it for further work.
3
If in addition to the diagrams in the paper an explanation is necessary, write the text. Then on the top toolbar, select "Insert". Click on the button and in the drop-down table, select the insert type is "picture". Then select which object you want to add to the document. In this case, you will need a "Chart".
4
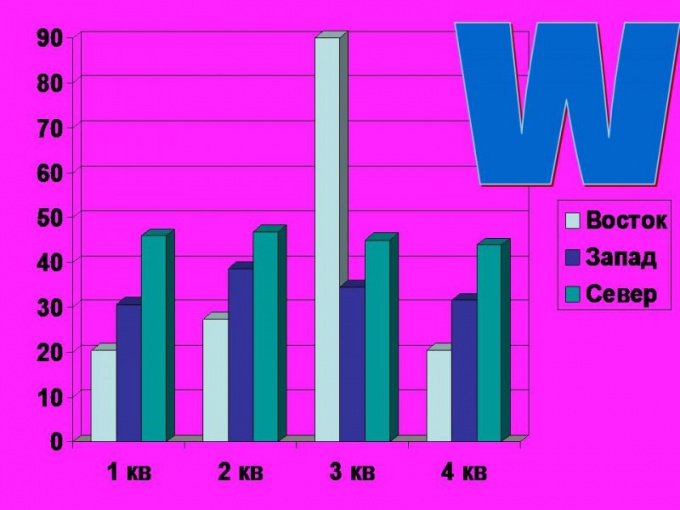
Click on the link, thereby adding a chart. By default, all charts of the same type. But if necessary, you can add in your data table. To do this in the popup with a chart table instead of the words "East", "West", "North", add your options. Which is enough to put the cursor in the table row and specify the required data. The first column indicates the name. In the second, third and subsequent – numeric data.
5
The number of indicators can be unlimited. As you need parameters, so you can add to the table. Place the cursor in the appropriate box and write the desired name and numerical data.
6
Clicking the chart and selecting the right click option "Format object" you can modify your chart, its background, name, position on page, size, and other properties.
7
To edit the chart, select "edit" on the toolbar and select "Chart Object". Then select the function "Edit", "Open" or "Convert". To make any changes.
8
To edit, you can go the other way. Simply click on the image and right click to select "Chart Object".


