
Instruction
1
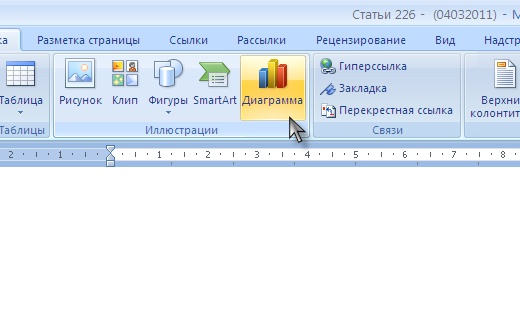
To make a graph in Word 2007 document, go to the insert tab and select Chart.
2
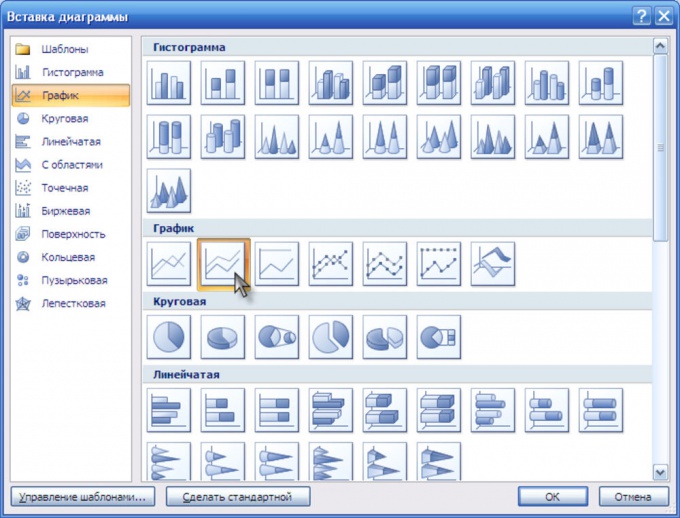
In the opened window click "Chart", choose one of the design options and click "OK".
3
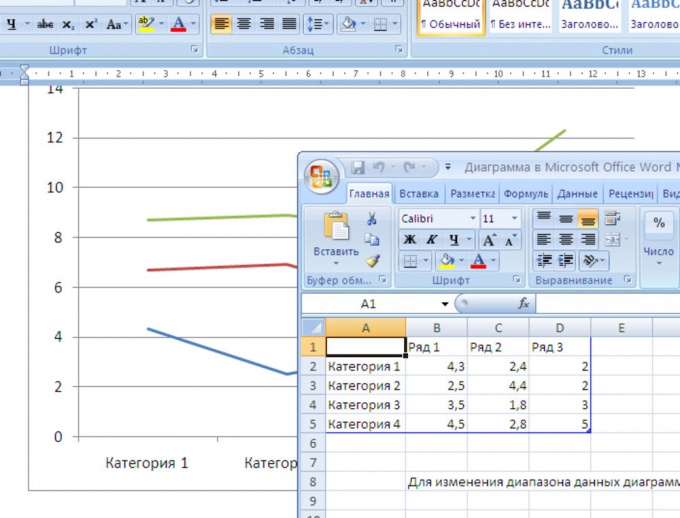
On the page of your document will appear in the chart and a window will open Excel spreadsheets for editing the displayed data.
4
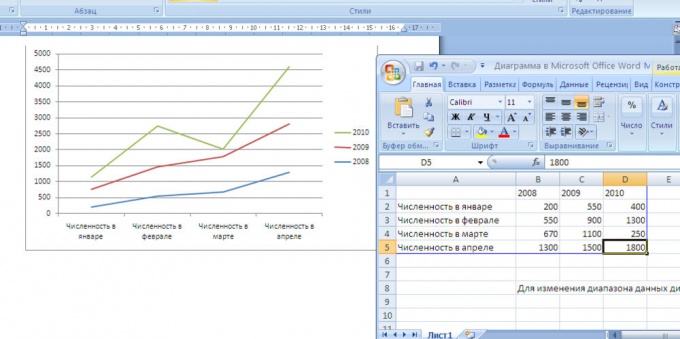
In the table window to Excel enter required statistical data, and you will see how the figures in the chart will change.
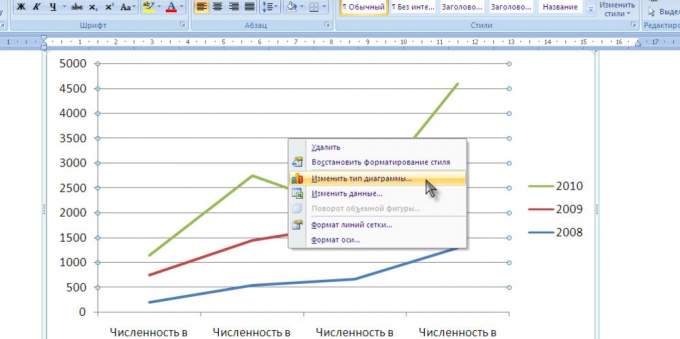
5
If after entering this data, the chart view does not suit you, you can always change to a more suitable one. To do this, right-click on the picture and select "Change chart type".
6
In the window that appears, select a different chart type and click OK. The graph will automatically change.

Useful advice
The resulting chart can be copied and pasted into Excel spreadsheet or Power Point presentation.