Instruction
1
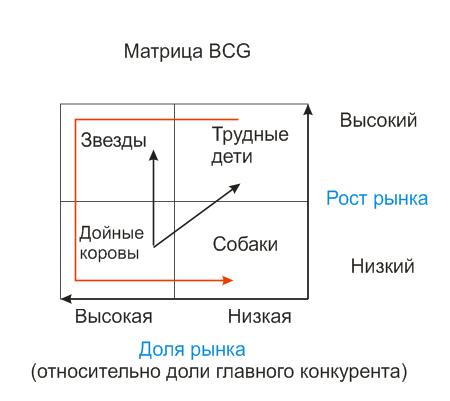
The matrix below represents the four squares, located on the axis of coordinates. The X axis is market growth rate, and the Y axis is the market share of a specific business unit in relation to a share held main competitor.
2
The coordinate space of the x-axis is divided in the following way: from 0 to 1 in increments of 0.1, and then from 1 to 10 in increments of 1. Market share is estimated respectively to the sales of all industry participants and is defined as the ratio of equity sales to sales of the main competitor or three strongest competitors. 1 means that sales are equal to sales strongest competitor.
3
The y-axis represents the market growth rate corresponding to each unit. The calculation takes into account all products of the company, and the value can be negative with a negative growth rate.
4
The bottom axis is the square that corresponds to the type of unit with the symbol "Dog" ("Lame duck", "Dead weight"). The lower right corner corresponds to the zero in the abscissa and ordinate. These units occupy the lowest market share and bring the least profit, and the goods are in the least demand. Thus there is active use of attachments.
From "Dogs" you need to get rid of by folding production.
From "Dogs" you need to get rid of by folding production.
5
To the left on the x-axis is a square, designating the type of unit a "Cash cow". Such units are characterized by high occupied market share, bring a low but steady income. Product is in low demand, but "Cow" does not require additional investment, which explains their value.
Funds from "Cash cows", investing in the development of the "Stars" and "Difficult children".
Funds from "Cash cows", investing in the development of the "Stars" and "Difficult children".
6
On the "Cows" is a square "Stars". This division, bringing in the most income and occupies the largest market share. Product is in great demand.
To retain market share, strengthening and expansion of production requires additional investments and attachments. Therefore, the net cash flowreceived from the "Stars" are quite low.
To retain market share, strengthening and expansion of production requires additional investments and attachments. Therefore, the net cash flowreceived from the "Stars" are quite low.
7
To the right of the "Stars" on the "Dogs" is square of "Difficult children" ("Dark horse", "question Marks", "Wild cats"). Represents the type of units that bring high profit, but occupying a small market share. The product is in high demand. High rates of growth.
For "Difficult children" should be closely monitored. In the future they can become like "Stars" and "Dogs". If there are available investment, they need to invest in "Children" with the aim of translating them into "Stars". If this is not possible, from "Difficult children" is to get rid of.
For "Difficult children" should be closely monitored. In the future they can become like "Stars" and "Dogs". If there are available investment, they need to invest in "Children" with the aim of translating them into "Stars". If this is not possible, from "Difficult children" is to get rid of.
8
Deficiencies in the BGC matrix, it is sufficient in view of the strong simplification of the situation. To the account taken only two factors affecting the profit, but actually them much more. Also, do not take into account the fact that the removal of the matrix "Dogs" can lead to the appreciation of the "Stars" and "Children", which has a negative impact in their market share, and consequently will lead to lower profits.
On the other hand, the matrix is a visual, easy to build, easy to understand. With its help you can quickly conduct an analysis of individual business units, scaling opportunities for their development in the future relative to the available investment portfolio.
On the other hand, the matrix is a visual, easy to build, easy to understand. With its help you can quickly conduct an analysis of individual business units, scaling opportunities for their development in the future relative to the available investment portfolio.
