To describe a graph, you need to study it – to understand whether there are peak values, whether there is a trend and forecast. You can also perform dips, lifts, alignment indicator on how much has changed percentage values or actual values, etc.
All this is possible with relative ease to do in Russian. But what if the situation involves a description in English? In most cases, if a person has enough vocabulary, but never had any experience of commenting on the charts in English, it will use a limited vocabulary. Most often it boils down to a simple description of fluctuations of a particular indicator by using verbs to decrease (decrease) and to increase (increase).
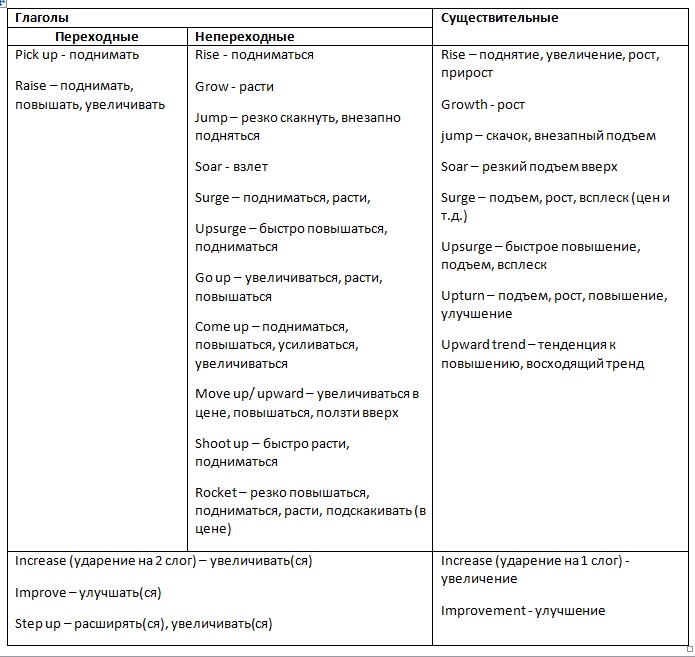
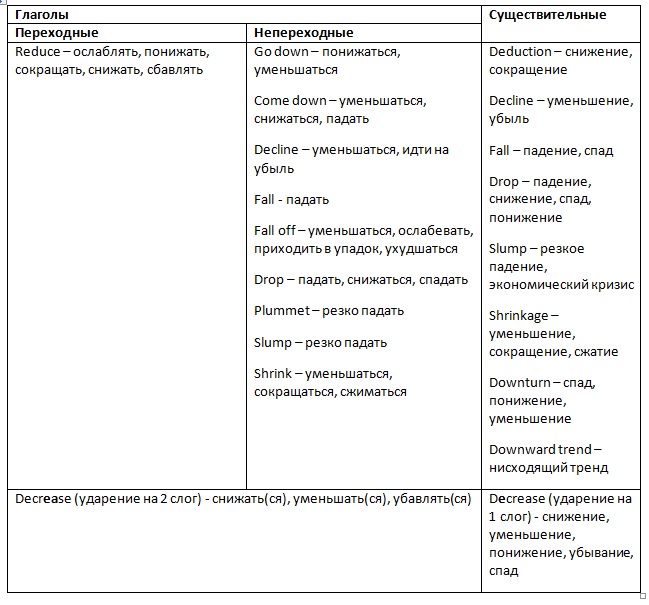
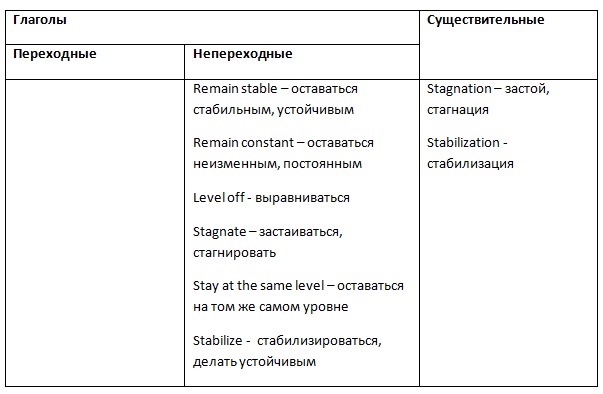
In fact, in English there are many words and phrases for describing graphs. They can be divided into verbs and nouns, showing growth or decline, as well as on adjectives and adverbs describing degree and speed of change. Used in this case verbs can be transitive (requiring itself after the noun, answering the question "who? what?") and intransitive. Some verbs are used in both cases, having different meanings.
Example:
- "I saw a fox yesterday" / "I saw (who? what?) Fox yesterday" is a transitive verb to see, the action moves to subject.
- "I went to the theatre yesterday" / "I went to the theatre yesterday" – intransitive verb to go, the action is not transferred to the object.
To describe the growth rates, uses the following words and phrases:

To describe the decline in use of the following expression:

To describe the alignment of the indicator:

There are also phrases to describe the peak values:
- Reach a peak – to peak values,
- Peak – to peak, peaks
- Top out - to reach the highest level, the highest point, to reach the peak
- Reach a low point to reach a low point, low
- Reach a trough to reach a low point
- Bottom out - to be at the lowest level, to achieve the lower limit
The degree of change (a slight growth to increase slightly):
- dramatic(ally) – a sharp, significant / drastically significantly
- considerable(ly) significant/significantly
- sharp(ly) sharp/sharply
- significant(ly) significant/significantly
- substantial(ly) - a significant, significant, significant / significantly, significantly, significantly
- moderate(ly) – moderate/mild
- slight(ly) – small, minor / a little, few, a little, slightly, poorly
Rate of change:
- abrupt(ly) sudden, unexpected / suddenly, unexpectedly
- sudden(ly) sudden/suddenly
- rapid(ly) quick, rapid / fast, rapidly
- quick(ly) – fast/quickly
- steady(ly) – stable/stable
- gradual(ly) gradual/gradually
- slow(ly) slow/slowly
Excuses to use:
- a rise from $1m to $2m – an increase from one to two million dollars
- to fall by 30% - to fall to 30%
- to increase to 50% - increase to 50%
- an increase of 7.5 per cent over last year – an increase of 7.5% over the past year
Presents words and phrases will help to avoid speech mistakes during describing graphs. Of course, you can use them not only for oral presentations and for written reports.
Please note that the skill descriptions graphics in English can not only help you to protect the relevant project in the University/school and correctly provide information, for example, to the employer, but will successfully carry out some tasks in the international business English examination, Business English Certificate (BEC).
