You will need
- - temperatures;
- paper;
- - handle;
- computer.
Instruction
1
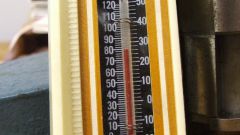
Collect temperature data. It is important that it is measured in similar conditions. For example, the air temperature must be measured by the thermometer located at the same height from the ground and from the shadow side. The temperature of a sick person it is advisable to change at the same time, for example, in the morning. To improve accuracy it is also desirable to use the same measuring devices.
2
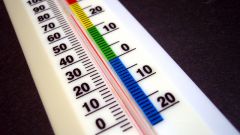
Choose what units you will record the temperature in degrees Celsius, Fahrenheit or Kelvin. It depends on the purpose of measurement and equipment used.
3
Draw on paper a two-dimensional coordinate system. On the abscissa will be determined the date or time of the temperature measurement, and the ordinate is in degrees. Make them relevant notes in a scale.
4
Fill in the chart with your data. For a start check point that X-axis will correspond to the temperature in degrees and the Y - axis is the date of measurement. Then connect the resulting points with lines. Have you got a graphshowing the change of temperature.
5
If you prefer to work on your computer, fill in the chart as a table using the editor to compile Excel spreadsheets. Create a new file, and in it a table with two columns - x and y. In the first column enter data about the date of the measurement as a number and the second temperature. After filling go to the menu "Insert" and then "Chart". Select the chartand that is most comfortable for you, and the sight scale markings, and then click on the "finish" button. The system will generate for you a graph of the temperature in accordance with your wishes.
Useful advice
To generate a more complex temperature graphs, for example, to calculate the parameters of systems of a heat supply, it is better to use special programs, for example, or other ZuluThermo.