You will need
- thermometer;
- - data on maximum and minimum temperatures:
- calculator;
- watch;
- - paper and pencil.
Instruction
1
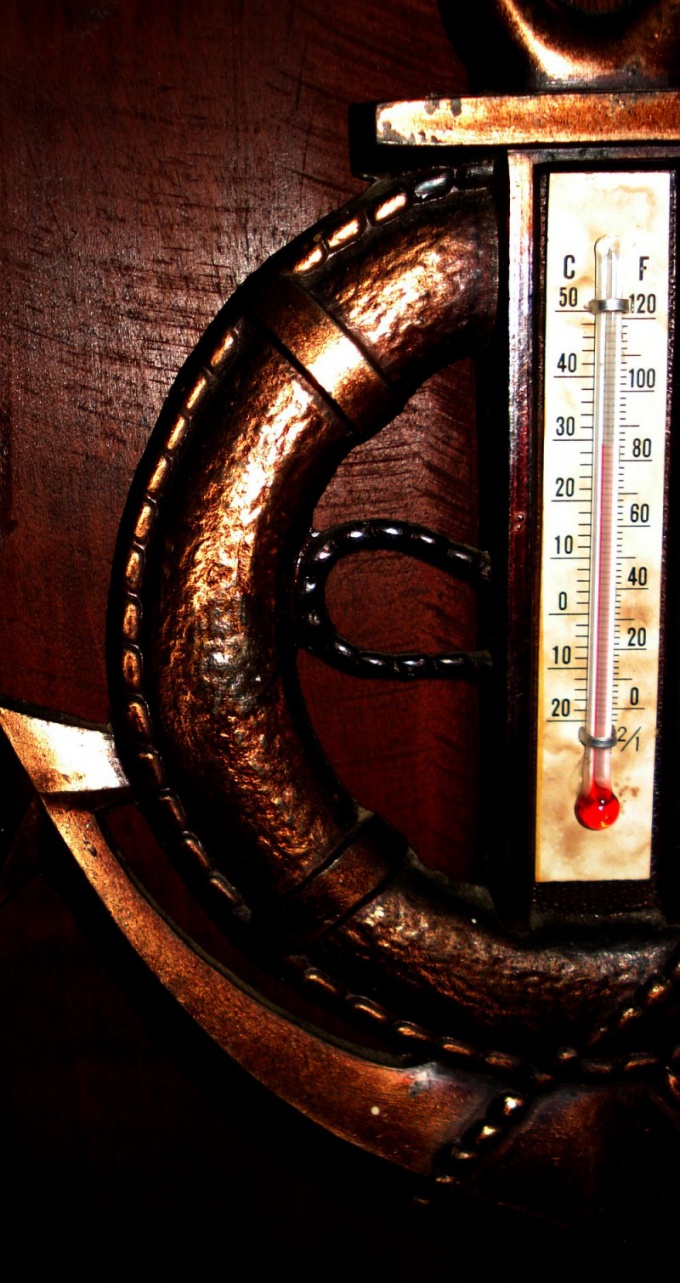
To determine the amplitude of the daily temperatures of external air take the ordinary street thermometer. In Russia as household thermometers usually used alcohol with Celsius. In other countries, it is also used scale of Fahrenheit or Reaumur. Often you can find doshkolnoye outdoor thermometers. In this situation, it is important to take readings at the same scale.
2
Decide how much time you will take readings. Meteorologists usually do it every three hours. The first measurement is carried out at 0 hours, then at 3am, 6 and 9 o'clock in the morning, at noon, 15, 18 and 21 hours. Better to count on astronomical time. Remove and note the reading.
3
Find the indices of the highest and lowest temperatures. Subtract from the maximum value to the minimum. This is the amplitude of the daily temperatures of outdoor air.
4
Similarly, determine monthly and annual amplitude of temperature. Take readings continuously after equal intervals of time. Very convenient to use for this special calendar. Divide a sheet of paper as is usually done in pocket calendars. The cell allotted for each day, divide by the number of time intervals. Bring the readings systematically, noting each day the highest and lowest temperature.
5
At the end of the month, write down all the extreme values. Find the highest temperature for the whole period, then the lowest. Calculate the difference between them. If you have to operate with negative numbers, perform arithmetic operations with them in exactly the same way as in ordinary math problems. For example, if the maximum temperature is +10°, and the minimum is also 10°, below zero, calculate the amplitude by the formula A=Tmax-Tmin=10-(-10)=10+10=20°,
6
The amplitude of temperature can be clearly observed on the chart. The horizontal axis is split into equal segments, mark at each measurement time. Select the length of the vertical axis — for example, 1°. Next to each time stamp select temperatures. Connect the points of the curve. Find the highest and lowest point. Distance between y-axis and is amplitude — in this case ambient temperatures.
7
To determine the amplitude of the temperature first find themselves average values. To find the average daily temperature, add all readings and divide the sum by the number of measurements. Perform this procedure for all days of the week or month. Find the maximum and minimum values. Subtract the first from the second.